I left my job around mid-May at Standard Chartered Bank and have been procrastinating for almost 2 months now. I plan to build a few applications and maybe earn from it or better, create a startup from it! For me to be able to build something startup-worthy, I need to be get up to speed with the entire stack (frontend, backend, APIs and infra).
After doing some self-assessment, I realised that I lacked experience in the latest frontend technologies. So I decided that I needed to do something about it. I know AngularJS but that is so outdated now. I’ve looked at Angular, Vue.js and React. After getting a feel of what’s in demand, I’ve decided to use React.
To start of my journey of learning React, I’ve gone through the Scrimba “Learn React” free course and so far it has really been helpful. Scrimba is really cool since you can try out the code immediately without having to install anything in your machine. You should try it out if you want to learn React.
After learning the basics, I also researched and ask some friends which frameworks to use so I don’t need to build everything from scratch. I’ve seen 2 of the most popular.
- Material UI - they claim to be the most popular React framework
- Ant Design for React - this design framework was developed by Alibaba
I’ve tried and read about both and I’ve chosen Ant Design since it had more components to start with. Their website was originally written in Chinese but so far it hasn’t been a problem since the Ant Design team did good enough translation of most of the documentation. Google translate also helped. Once you know React, using Ant Design is pretty straightforward. You can follow the Ant Design “Getting Started” guide if you want to create a new application using their framework.
I was clearly satisfied with Ant Design. However, I wanted a framework which can do a bit more scaffolding - in short I wanted a dashboard. Aivan, our previous senior frontend developer suggested that I tried Ant Design Pro, an “Out-of-box UI solution for enterprise applications” as they coined in their website. Very cool!
Since in Standard Chartered, I was responsible for recruiting growing the team, I thought of doing some innovation in the recruitment space. One of my problems before was doing pre-screening of resumes/CVs of candidates by reading them and identifying who to shortlist. It consumed so much of my time! As a developer myself, this didn’t make sense! So one of the things I thought of is modernizing the resume, to make it more dynamic, data-driven and appealing to hiring managers and recruiters. If you are like me with almost 20 years of experience, you would agree that our resume won’t fit in 2 pages anymore. I felt this was a good candidate for using my newly acquired knowledge of React.
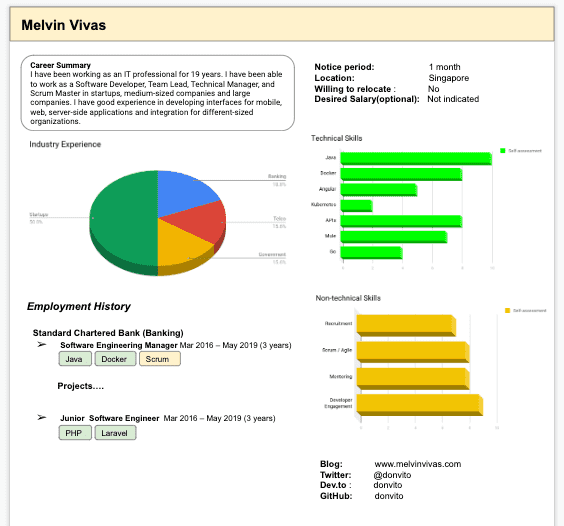
So, I immediately did a mockup of my idea using Google Slides. Here is what I came up with. It looked simple when I was doing it but the graphs would sure be a challenge. I thought to myself, this would definitely take some time.
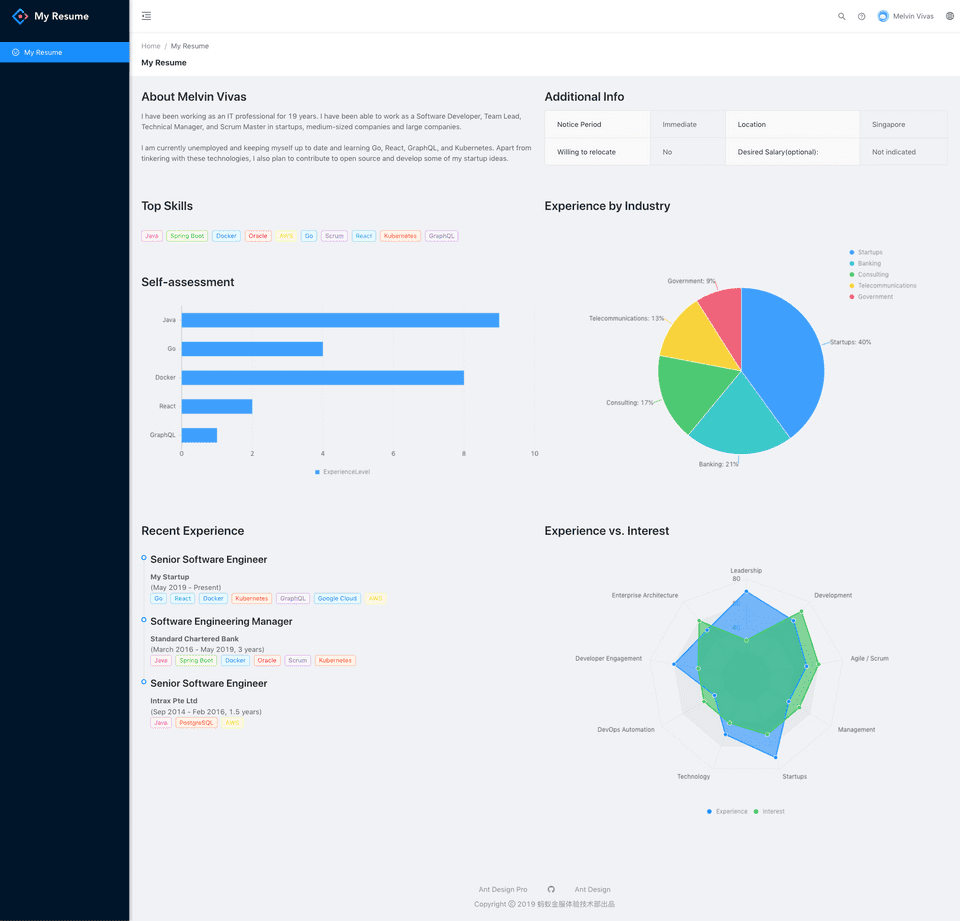
Using Ant Design Pro, with just beginner knowledge in React, I was able to code the web user interface in 3 hours, no backend API calls yet, just the UI. I was really surprised I was able to come up with such elaborate components in just a few hours of coding. The charts was pretty straightforward. I used BizCharts for the charts, also developed by Alibaba. For some reason, I am not able to make the built-in chart library of Ant Design Pro.
The code is deployed using Netlify, you can access it using this link. https://5d2e8611ef8bbf8913c545f6—epic-bardeen-7f6cf7.netlify.com/
Below is the sample radar component I’ve added. Code is was taken from the Radar chart documentation. The only change I did here is rather than using ReactDOM.render(), I just exported it so it can be reused in resumeportal/src/pages/Welcome.jsx.
All source code is available in this github repo.
import React from "react";
import {
  G2,
  Chart,
  Geom,
  Axis,
  Tooltip,
  Coord,
  Label,
  Legend,
  View,
  Guide,
  Shape,
  Facet,
  Util
} from "bizcharts";
import DataSet from "@antv/data-set";
import { Typography } from 'antd';

const { Title } = Typography;

class Radar extends React.Component {
  render() {
    const { DataView } = DataSet;
    const data = [
      {
        item: "Leadership",
        Experience: 70,
        Interest: 30
      },
      {
        item: "Development",
        Experience: 60,
        Interest: 70
      },
      {
        item: "Agile / Scrum",
        Experience: 50,
        Interest: 60
      },
      {
        item: "Management",
        Experience: 40,
        Interest: 50
      },

      {
        item: "Startups",
        Experience: 70,
        Interest: 50
      },
      {
        item: "Technology",
        Experience: 50,
        Interest: 40
      },
      {
        item: "DevOps Automation",
        Experience: 30,
        Interest: 40
      },
      {
        item: "Developer Engagement",
        Experience: 60,
        Interest: 40
      },
      {
        item: "Enterprise Architecture",
        Experience: 50,
        Interest: 60
      }
    ];
    const dv = new DataView().source(data);
    dv.transform({
      type: "fold",
      fields: ["Experience", "Interest"],
      // 展开字段集
      key: "user",
      // key字段
      value: "score" // value字段
    });
    const cols = {
      score: {
        min: 0,
        max: 80
      }
    };
    const chartHeight = 600
    return (
      <div>
        <Title level={3}>Experience vs. Interest</Title>
        <Chart
          height={chartHeight}
          data={dv}
          padding={[20, 20, 95, 20]}
          scale={cols}
          forceFit
        >
          <Coord type="polar" radius={0.8} />
          <Axis
            name="item"
            line={null}
            tickLine={null}
            grid={{
              lineStyle: {
                lineDash: null
              },
              hideFirstLine: false
            }}
          />
          <Tooltip />
          <Axis
            name="score"
            line={null}
            tickLine={null}
            grid={{
              type: "polygon",
              lineStyle: {
                lineDash: null
              },
              alternateColor: "rgba(0, 0, 0, 0.04)"
            }}
          />
          <Legend name="user" marker="circle" offset={30} />
          <Geom type="area" position="item*score" color="user" />
          <Geom type="line" position="item*score" color="user" size={2} />
          <Geom
            type="point"
            position="item*score"
            color="user"
            shape="circle"
            size={4}
            style={{
              stroke: "#fff",
              lineWidth: 1,
              fillOpacity: 1
            }}
          />
        </Chart>
      </div>
    );
  }
}

export default Radar
That’s it! Hope you liked this post!
P.S. For updates, you can follow my blog and Twitter @donvito. Most of my tweets are about Docker, Kubernetes, GoLang, Cloud, DevOps, Agile and Startups. I also share code in my GitHub. If you want to know more about what I do, please add me in LinkedIn. I recently started a new youtube channel - I upload some tutorials there. Check it out!

