A colleague of mine said that…
“You are not a real programmer if you don’t know how to debug your applications!”
Oh well, that is true! If you don’t know how to debug your applications, then you can’t build better software.
Debugging applications has been easier with the help of IDEs. One popular and very good IDE for Go is Goland by Jetbrains, same company who developed IntelliJ for Java developers and Webstorm for web/javascript developers.
gdb can be used for debugging Go applications but according to the golang website, delve is even better.
Note that Delve is a better alternative to GDB when debugging Go programs built with the standard toolchain. It understands the Go runtime, data structures, and expressions better than GDB.
Since the golang developers recommended Delve, I took it for a spin and see how it can be used to create better software built with Go.
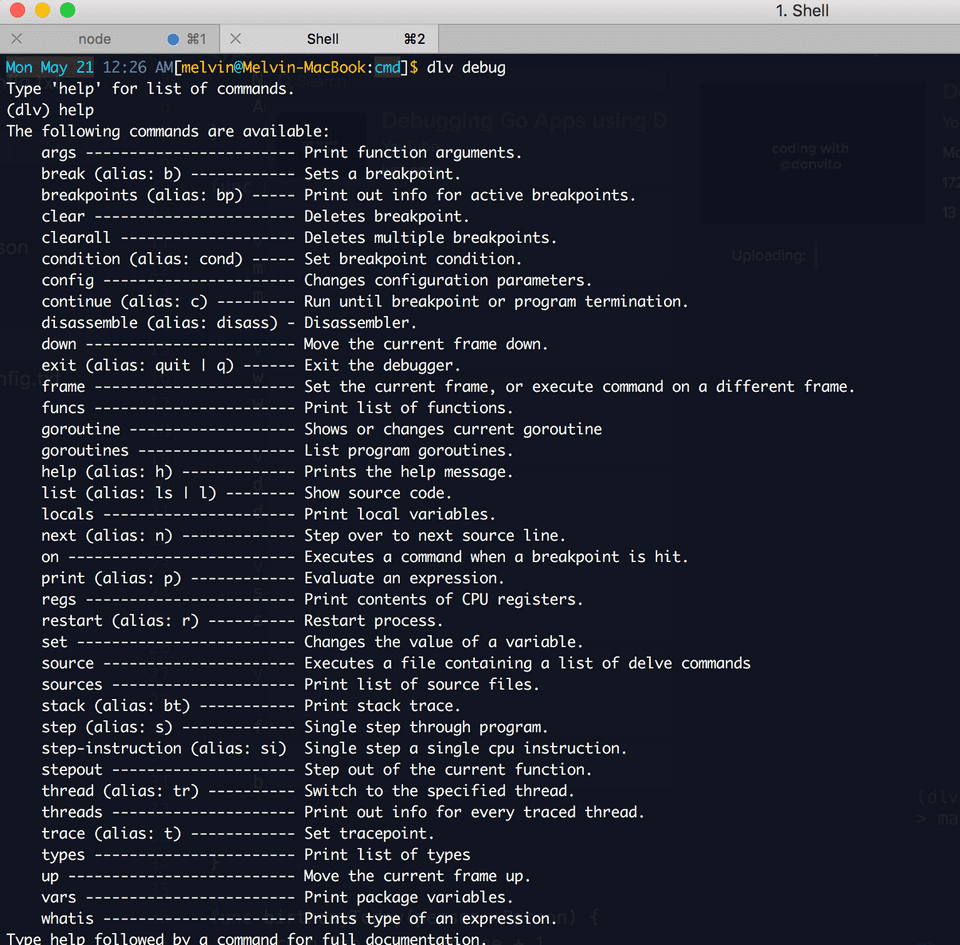
Here’s a list of available commands in delve

I thought of blogging about it but I felt it was better to show a demo of it. Here is the recording I did to showcase delve’s awesomeness!
Here’s the demo (best viewed in full screen mode)
Sample code I used for the demo
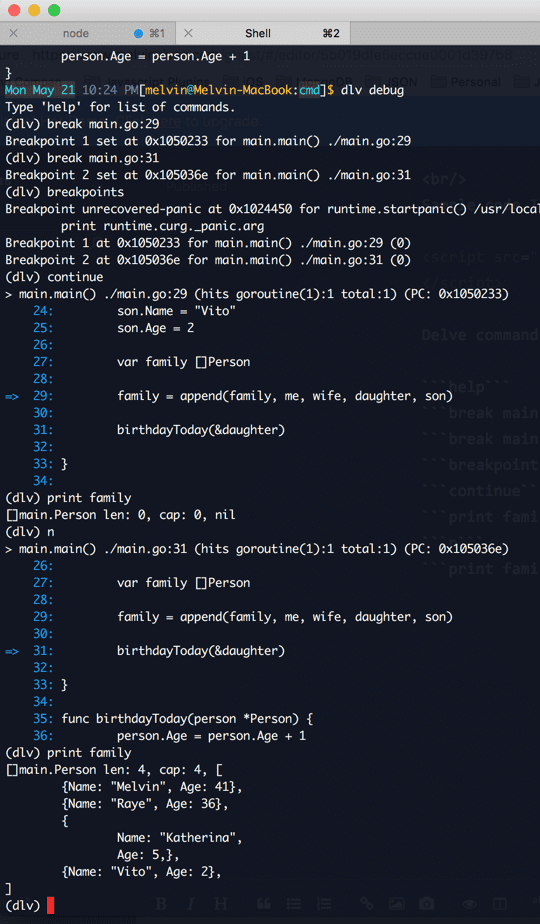
Delve commands you can try out
(dlv) help
(dlv) break main.go:29
(dlv) break main.go:31
(dlv) breakpoints
(dlv) continue
(dlv) print family
(dlv) n
(dlv) print family